Creating Dataview
Dataview is a tool designed to help you monitor and analyze sensor data in structured and interactive way. Dataviews are highly customizable, allowing you to focus on the data that matters most for your operations. Some key features of Dataviews include data visualization, which enables users to display information through charts, and calculations, such as averages or sums, derived from sensor measurements. To create Dataview:
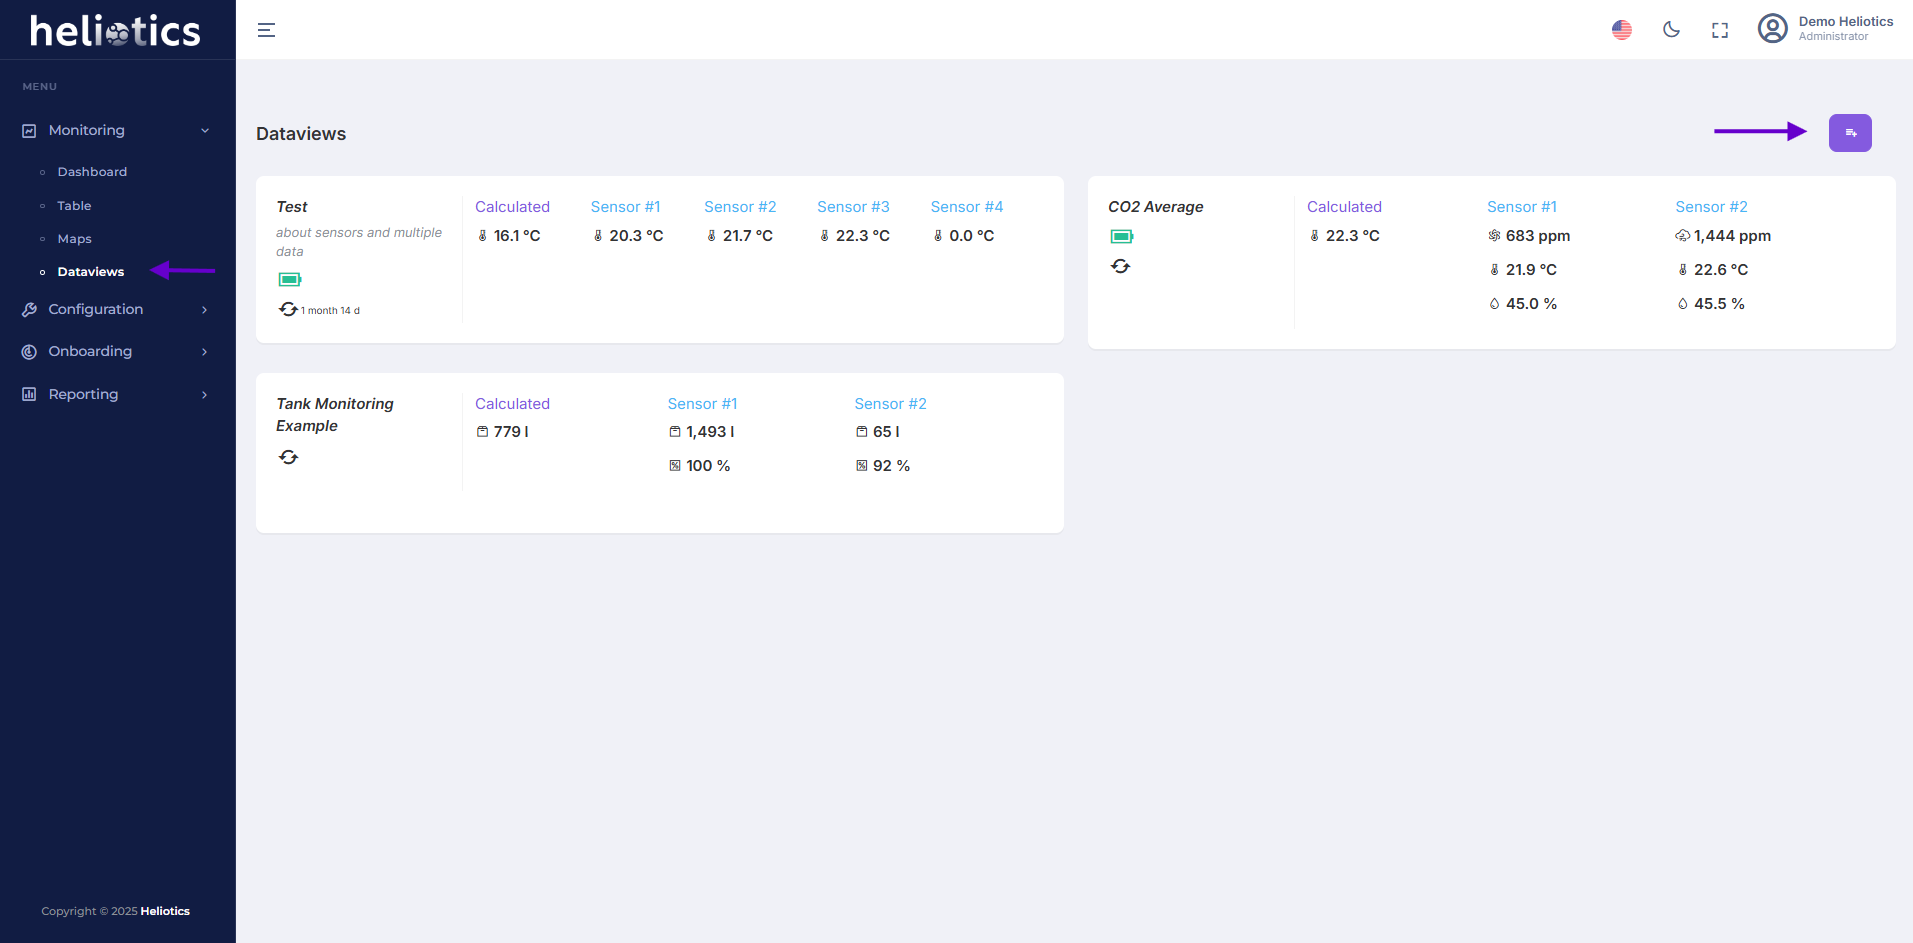
- Navigate to the Monitoring category and select Dataviews
- Click the Create Dataview button
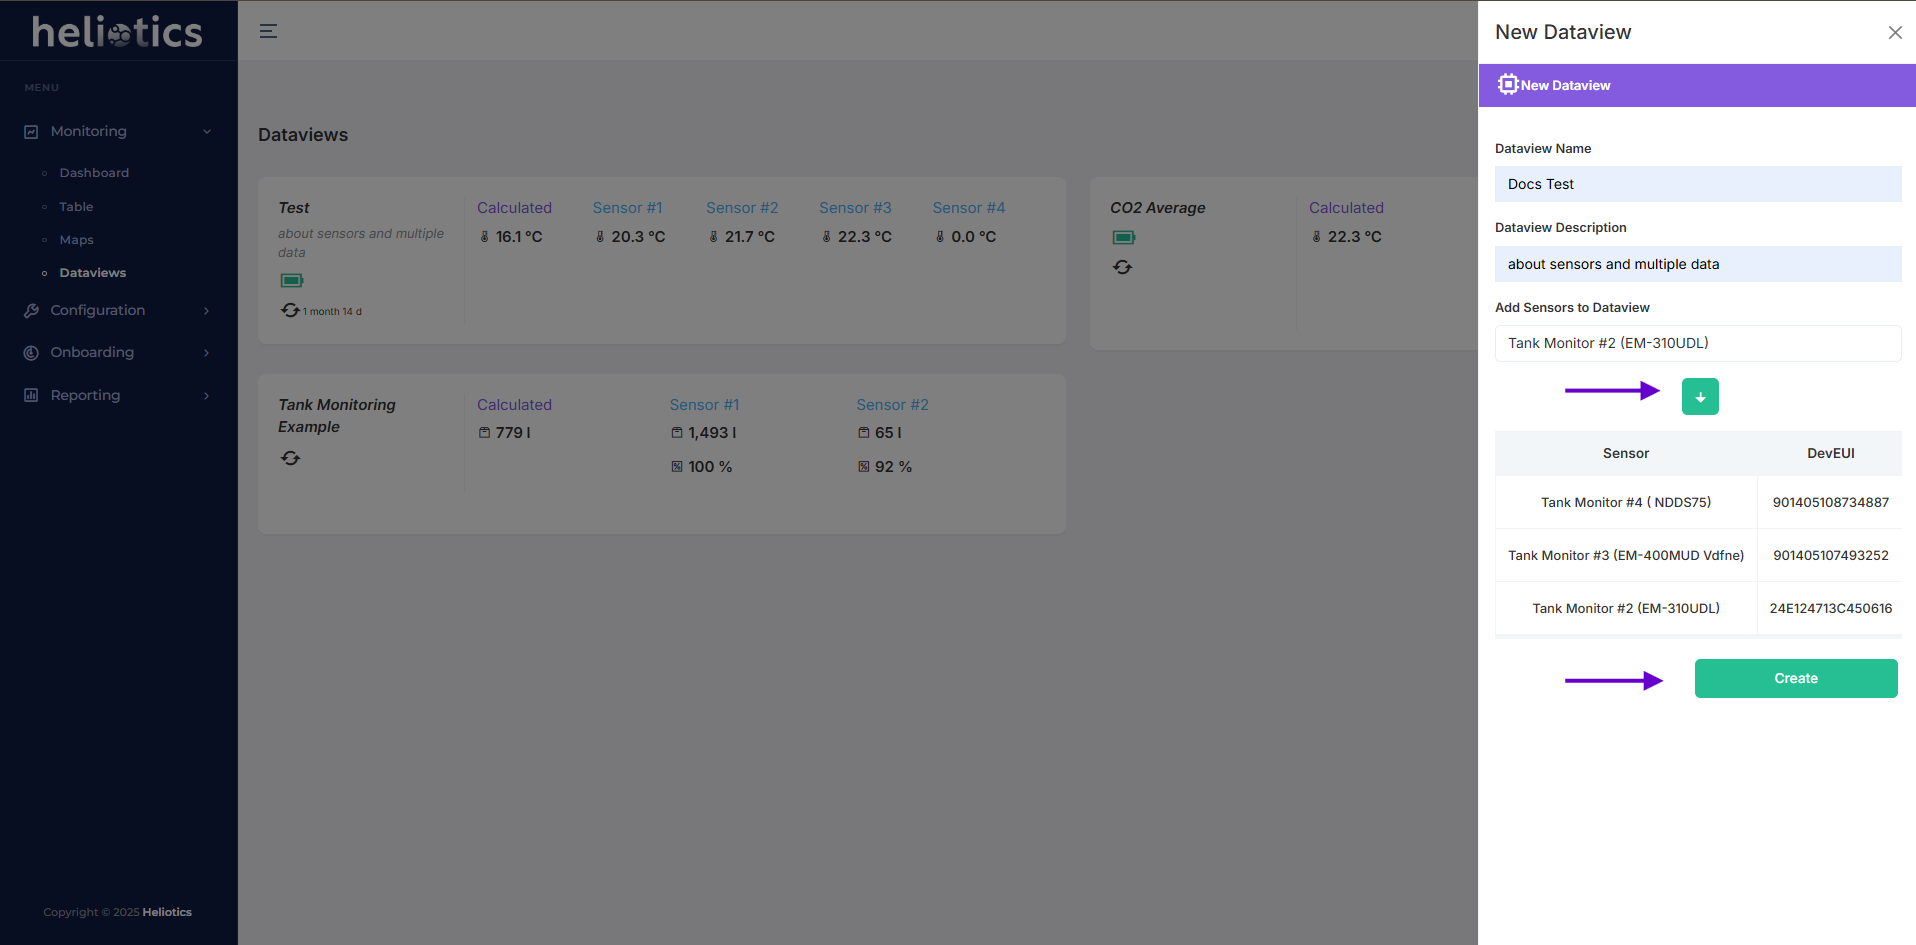
Dataview Configuration
- In the general section provide details like name for your dataview and short description about the purpose of it.
- Select data source, choose the sensor you want to include in the Dataview. To include sensor in the Dataview click on the continue icon
- After you added all the sensors you want to include in the dataview click on the Create button
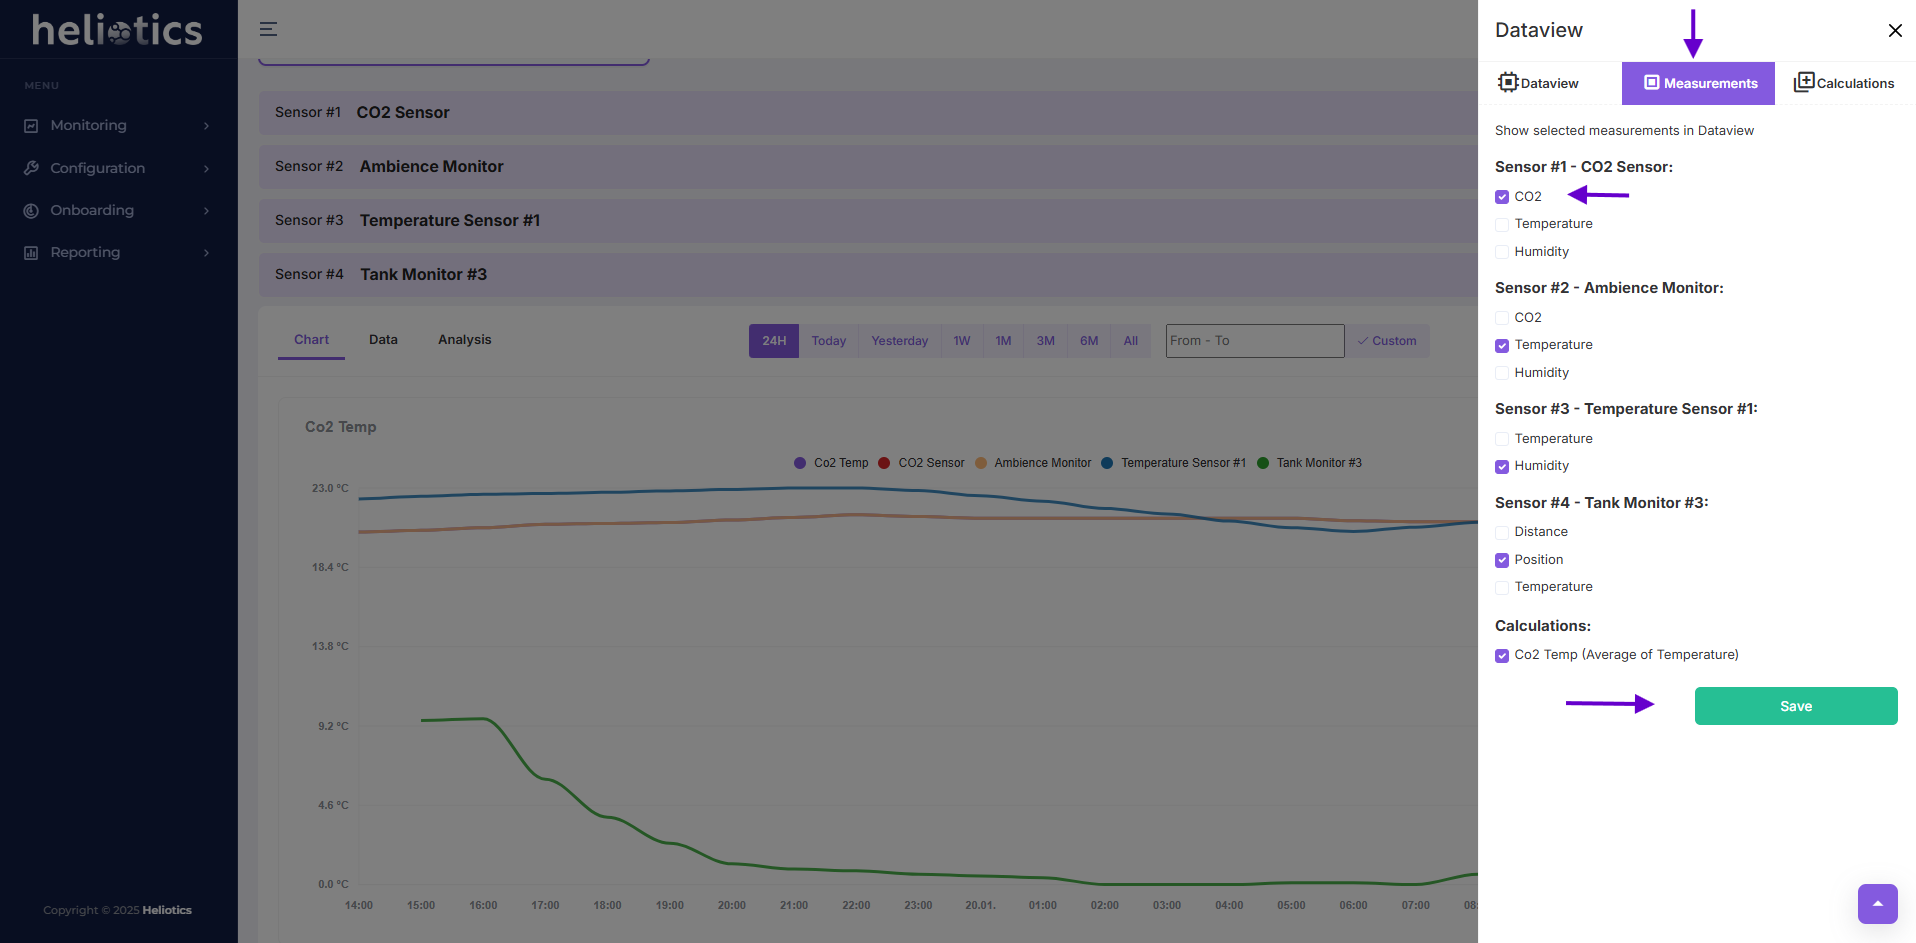
Selecting Measurements
The Measurements tab in Dataviews allows users to customize the data displayed by selecting specific measurements from sensors. User can:
- Select Sensor Measurements: Choose which measurements (e.g., temperature, humidity, CO2 levels) from individual sensors will be shown in the Dataview
- Customize Data Display: Tailor the Dataview to focus only on the data relevant to your monitoring needs by checking or unchecking the desired measurements
After selecting the disered measurements, click Save to update the Dataview and display the selected data in real-time